Support our educational content for free when you purchase through links on our site. Learn more
Who Really Gets the Most Speeding Tickets? 🚦 (2025)

You might think it’s the reckless teenager or the flashy sports car driver, but the truth about who racks up the most speeding tickets might surprise you. From age and gender to income and even the type of car you drive, the data paints a complex picture that challenges common stereotypes. Did you know that middle-aged adults actually receive more speeding tickets than teens? Or that men get ticketed far more often than women? And what about the role of race and socioeconomic status in traffic enforcement—how much does bias influence who gets pulled over?
In this deep dive, we’ll unpack the latest research, reveal surprising trends, and share expert tips to help you avoid becoming a statistic. Plus, we’ll explore how your vehicle choice and where you drive can put you in the ticketing crosshairs. Ready to find out if you’re in the high-risk demographic? Buckle up!
Key Takeaways
- Adults aged 30-49 receive the most speeding tickets overall, challenging the stereotype that teens are the biggest offenders.
- Men get ticketed significantly more than women, with some age groups showing double or triple the number of citations.
- Racial disparities in traffic stops and ticketing are well-documented, with minority drivers often receiving less leniency.
- Vehicle type matters: sporty and affordable performance cars like the Subaru WRX and Volkswagen GTI are frequent ticket magnets.
- Location influences ticket rates, with some states and urban vs. rural areas showing distinct enforcement patterns.
- Speeding tickets have far-reaching consequences, including insurance hikes, points on your license, and potential legal trouble.
- Smart driving habits and knowing your rights are your best defenses against getting pulled over and ticketed.
Want to explore which cars are most often ticketed or find expert advice on safer driving? Keep reading!
Table of Contents
- ⚡️ Quick Tips and Facts
- 📜 The Unseen History of Traffic Enforcement: A Demographic Lens
- 🔍 Who’s Really Getting Pulled Over? Unpacking the Data
- 👶 Age: Are Young Drivers Really the Worst Offenders?
- 👫 Gender: The Battle of the Sexes Behind the Wheel
- 🌍 Race and Ethnicity: A Complex Picture of Disparity in Traffic Stops
- 💰 Socioeconomic Status: The Hidden Costs of Driving Violations
- 🚗 Vehicle Type: Does Your Car Make You a Target for Speeding Tickets?
- 📍 Location, Location, Location: Urban vs. Rural Enforcement Patterns
- 💸 Beyond the Ticket: The Ripple Effect of Speeding Violations
- 🤔 Why Do Certain Demographics Appear More in the Data? Exploring the Factors
- ✅ How to Avoid Becoming a Statistic: Our Expert Tips for Safer Driving
- 🔮 The Future of Traffic Enforcement: Tech, Data, and Fairness on Our Roads
- 🏁 Conclusion: Navigating the Complexities of Speeding Tickets and Demographics
- 🔗 Recommended Links for Further Reading and Resources
- ❓ FAQ: Your Burning Questions About Speeding Tickets Answered
- 📚 Reference Links: Our Sources and Data
Body
⚡️ Quick Tips and Facts
Welcome, gearheads and daily drivers! Ever wondered if that flashing red and blue in your rearview has a favorite type of driver? You’re not alone. Here at Car Brands™, we live and breathe everything automotive, and that includes the nitty-gritty of traffic stops. Before we dive deep, here are some quick-fire facts to get your engine started:
- It’s Not Just Teens: Surprise! While young drivers are often stereotyped as speed demons, data suggests that drivers in the 30-49 age range actually get ticketed the most.
- Income Plays a Role: Some studies point to a fascinating correlation: drivers with higher incomes (over $75,000) are more likely to get a ticket. The theory? A speeding fine is less of a financial deterrent.
- Gender Gap: Sorry, fellas. Data consistently shows that men receive significantly more speeding tickets than women—in some cases, 50% more across all age groups.
- Your Car Matters: Yes, the car you drive can make you a target. Sporty, affordable models often top the charts for the most ticketed vehicles.
- Location is Key: Where you live and drive has a huge impact. States like Ohio and Iowa have some of the highest rates of speeding tickets per capita.
- The Red Car Myth: Is it true that red cars are ticket magnets? The answer is… complicated. While some data shows red cars get a disproportionate number of tickets compared to how many are on the road, other studies show white cars get the most tickets overall.
- Disparities Exist: Troubling data from multiple sources, including the Stanford Open Policing Project, reveals significant racial disparities in who gets pulled over and how they are treated during traffic stops.
📜 The Unseen History of Traffic Enforcement: A Demographic Lens
To really understand who gets the most speeding tickets today, we need to pop the hood on the history of traffic enforcement itself. It wasn’t always about radar guns and laser detectors! The story of the speeding ticket is intertwined with the rise of the automobile and the ever-evolving relationship between drivers, law enforcement, and society.
Early on, with cars being a luxury for the wealthy, enforcement was sporadic. But as vehicles became accessible to the masses post-World War II, the need for structured traffic laws—and penalties—exploded. This is where patterns began to emerge. The construction of the Interstate Highway System in the 1950s created long, straight stretches of road that practically begged drivers to push the limits, leading to a new era of highway patrols and ticketing.
Over the decades, stereotypes began to form, often fueled by pop culture: the rebellious teen in a hot rod, the aggressive male driver, the flashy sports car. These perceptions, whether based in reality or not, have subtly shaped policing priorities and public assumptions. As we’ll explore, while some of these stereotypes have a grain of truth, the full picture is far more complex and influenced by everything from economic status to systemic biases in policing. This history provides the crucial context for the data we see today, reminding us that traffic stops don’t happen in a vacuum.
🔍 Who’s Really Getting Pulled Over? Unpacking the Data
Alright, let’s get down to brass tacks. Who is really getting that dreaded piece of paper slipped under their windshield wiper? The answer is a fascinating, and sometimes controversial, mosaic of age, gender, income, and even the type of car you drive. We’ve sifted through the data, reconciled conflicting reports, and are here to give you the full scoop.
👶 Age: Are Young Drivers Really the Worst Offenders?
It’s one of the oldest stereotypes in the book: young drivers, full of adrenaline and lacking experience, are the biggest culprits when it comes to speeding. And yes, drivers between 16 and 25 do account for a significant chunk of tickets. Their risky behaviors, from showing off to simple inexperience, make them a frequent focus for law enforcement.
However, the plot thickens! Several sources, including one from Steve Dixon Law, argue that the demographic with the most speeding tickets isn’t teens, but adults between 30 and 49 years old. Another study confirms this, noting that drivers in the 30- to 49-year-old range are the most ticketed.
So, what gives? How can both be true?
- Perspective 1 (The Stereotype): Younger drivers are indeed more prone to risky behavior and get a high volume of tickets. They are often less experienced, more impulsive, or influenced by peer pressure.
- Perspective 2 (The Reality): Middle-aged adults, often busy professionals and parents with demanding schedules, may speed more out of necessity or because the financial sting of a ticket is less severe. As one source puts it, “A college student with $500 in a bank account just can’t afford a speeding ticket,” whereas a professional with a steady income can absorb the cost more easily.
Our Take: It’s not an either/or situation. Young drivers likely get ticketed for more overtly reckless behavior, while the 30-49 demographic racks up citations through consistent, everyday speeding—shaving a few minutes off the commute here, rushing to daycare there. Both are statistically significant, just for different reasons.
👫 Gender: The Battle of the Sexes Behind the Wheel
When it comes to gender, the data is far less ambiguous. Men consistently receive more speeding tickets than women. It’s not even a close race.
- According to data from the Minnesota State Patrol, men of every age get at least 50% more speeding tickets than women.
- The gap widens with age; male drivers over 55 get a staggering 200% more tickets than their female counterparts.
- DriveSafe Online notes that men are not only more likely to drive too fast but receive 13% more tickets overall.
Why the disparity? The prevailing theory points to behavioral differences. Men are often perceived as more aggressive and competitive drivers, more willing to take risks behind the wheel. While this is a generalization, the ticketing data across multiple states and years strongly supports the conclusion that male drivers are ticketed for speeding more often.
🌍 Race and Ethnicity: A Complex Picture of Disparity in Traffic Stops
This is where the conversation becomes incredibly important and deeply concerning. An overwhelming body of evidence shows significant racial disparities in traffic enforcement. It’s not just about who speeds, but about who gets stopped and how they are treated.
A landmark analysis by the Stanford Open Policing Project, which examined nearly 100 million traffic stops, found that Black drivers were about 20% more likely to be stopped than white drivers relative to their population share.
The article from Econofact, “What Drives Racial Differences in Speeding Tickets?”, dives even deeper, highlighting a phenomenon called “discounting.” This is where an officer has the discretion to write a ticket for a lower speed than what was recorded to reduce the fine. Their research found:
- White drivers are significantly more likely to receive this leniency than minority drivers.
- While minority drivers were stopped at slightly faster speeds on average, it wasn’t enough to explain the large gap in leniency.
- The article concludes, “A significant share of the gap in treatment is due to officer discrimination in lenience.”
Furthermore, data from the Public Policy Institute of California shows that Black drivers are markedly overrepresented in traffic stops, making up 14% of stops despite being only 6% of the population. They are also searched far more often than white drivers during these stops. This suggests that the issue isn’t just about driving behavior, but about enforcement patterns and potential bias. As Econofact states, “Minority drivers are more likely to encounter officers that offer no leniency to drivers of any race,” highlighting how geography and officer assignment can worsen these disparities.
💰 Socioeconomic Status: The Hidden Costs of Driving Violations
As mentioned earlier, income plays a fascinating role. The demographic often cited as receiving the most tickets are those earning over $75,000 per year. For this group, the financial penalty of a standard speeding ticket may be viewed as a “cost of doing business” for a busy lifestyle rather than a true deterrent.
However, for low-income drivers, the consequences are vastly different. A single ticket can spiral into a significant financial crisis, potentially leading to a suspended license if they can’t afford to pay. This has led some jurisdictions, like Los Angeles and San Francisco, to pilot programs that tie traffic fines to the driver’s income level, aiming for a more equitable system. The idea is to make the penalty proportionate, ensuring it’s a deterrent for everyone, not just a minor inconvenience for the wealthy.
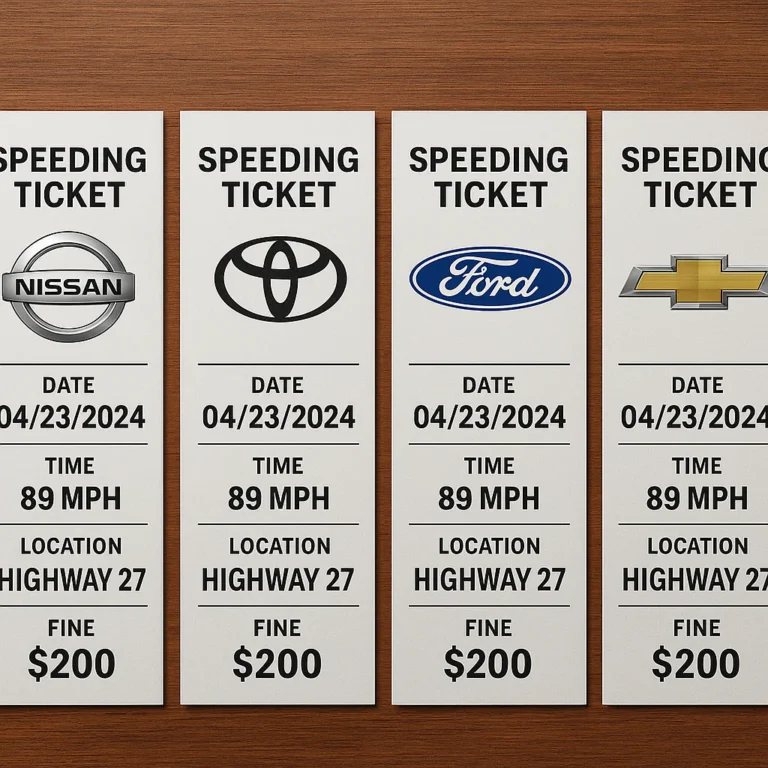
🚗 Vehicle Type: Does Your Car Make You a Target for Speeding Tickets?
You bet it does! The car you choose says a lot about your driving style, and police officers know it. While you might think high-end supercars are the biggest ticket magnets, the data often points to more affordable, sporty models. If you’re curious about local trends, check out our deep dive into The 7 Most Ticketed Cars in Pennsylvania 🚗 (2025).
So which cars are flashing beacons for law enforcement?
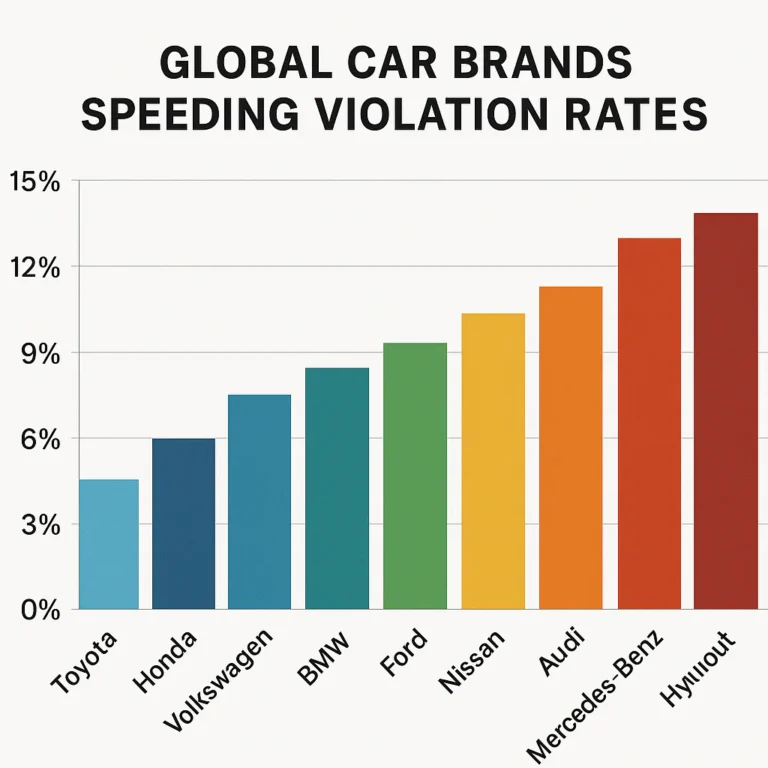
- The usual suspects: An Insurify study points to brands like Infiniti, Scion, and Subaru as having the highest percentage of drivers with a speeding violation. Models like the Subaru WRX and Hyundai Genesis Coupe are consistently at the top of these lists.
- Surprising offenders: As the featured video in this article points out, the most ticketed car in one two-year survey was the Lexus ES 300, with a whopping 33% of its drivers reporting a ticket! Other surprises in the top 5 included the Nissan 350Z and the Dodge Charger SE/SXT.
Here’s a quick look at some of the models that frequently appear on “most ticketed” lists, which you can find in our Car Brand Lists:
| Car Model | Noteworthy Fact |
|---|---|
| Subaru WRX / BRZ | These rally-inspired cars attract enthusiasts who love to test their limits. |
| Volkswagen Golf GTI | Described as a “speedy box-on-wheels,” it can go from 0 to 60 in just over 5 seconds. |
| Dodge Charger | A modern muscle car with an aggressive look that screams “speed.” |
| Infiniti G37 | A luxury sports sedan that blends performance with style, attracting lead-footed drivers. |
| Scion FR-S | Even though the brand is discontinued, this affordable sports coupe remains a ticket magnet. |
👉 Shop these frequently ticketed brands on:
- Subaru: TrueCar | Edmunds | Subaru Official Website
- Dodge: TrueCar | Edmunds | Dodge Official Website
- Volkswagen: TrueCar | Edmunds | Volkswagen Official Website
📍 Location, Location, Location: Urban vs. Rural Enforcement Patterns
Where you drive is just as important as what you drive. Some states are simply more aggressive with their traffic enforcement. According to DriveSafe Online, the top states for speeding tickets per capita include Ohio, Iowa, and North Dakota.
There are also key differences between urban and rural areas:
- Urban Areas: Denser traffic can sometimes mean lower average speeds, but it also means more police presence and a higher likelihood of getting caught for violations like running red lights or aggressive lane changes.
- Rural Areas: Long, open highways can tempt drivers to speed. State troopers often patrol these stretches heavily, setting up speed traps in areas where the speed limit suddenly drops.
💸 Beyond the Ticket: The Ripple Effect of Speeding Violations
Getting a speeding ticket is more than just a one-time fine. Oh no, my friends, it’s the gift that keeps on taking. That single piece of paper can trigger a cascade of consequences that will haunt your wallet and your driving record for years to come.
🛡️ Insurance Premiums: Your Wallet’s Worst Nightmare After a Citation
This is the big one. After the initial fine, the most painful hit comes from your auto insurance company. Insurers see a speeding ticket as a giant red flag that you’re a higher-risk driver.
- How much will it go up? The increase varies wildly based on the severity of the violation, your driving history, and your insurer. A minor speeding ticket might raise your rates by a few percentage points. However, a more serious offense could cause your premiums to soar by 20-30% or even more. That can add up to hundreds, or even thousands, of dollars over the three to five years a ticket typically stays on your record.
- Losing Discounts: ✅ One of the first things to go is your “good driver” discount. That bonus you’ve been enjoying for years? Poof! Gone.
- The Three-Year Rule: Most insurers will penalize you for a speeding ticket for at least three years. So that one mistake will be costing you money long after you’ve forgotten about it.
📉 Driving Records: Points, Suspensions, and Future Woes
Most states use a point system to track your driving infractions. Each moving violation, including speeding, adds points to your license.
- How it Works: A minor speeding ticket might be 2 or 3 points, while a more serious one could be 5 or 6. The specific values vary by state. For example, in New York, accumulating 11 points in 18 months can lead to a suspension.
- The Tipping Point: If you accumulate too many points within a specific timeframe (usually 12-24 months), you face serious consequences.
- ❌ License Suspension: Your driving privileges can be temporarily suspended.
- ❌ License Revocation: For severe or repeat offenses, your license could be taken away entirely.
- ❌ Mandatory Driver Education: You may be required to attend a defensive driving course at your own expense.
⚖️ Legal Ramifications: When a Traffic Ticket Becomes More Serious
While most speeding tickets are simple infractions, certain situations can elevate them to a criminal offense.
- Reckless Driving: Excessive speeding (e.g., going 25+ mph over the limit) can often be charged as reckless driving, which is a misdemeanor in most states. This means potential jail time, much larger fines, and a criminal record.
- DUIs and Other Offenses: If you’re pulled over for speeding and the officer suspects you’re under the influence, the situation escalates dramatically.
- Court Appearances: For more serious violations, you may be required to appear in court, which means taking time off work and potentially hiring a lawyer.
🤔 Why Do Certain Demographics Appear More in the Data? Exploring the Factors
So we’ve seen who gets ticketed, but the million-dollar question is why? Is it purely about behavior on the road, or are other, more complex forces at play? The answer, as you’ve probably guessed, is a mix of everything. Let’s break down the driving factors behind the data.
🚦 Driving Habits and Risk-Taking Behavior Across Groups
Let’s be honest: some people just drive faster than others. This is the most straightforward explanation for the disparities we see.
- Youth and Impulsivity: Younger drivers are neurologically more prone to risk-taking. Their brains are still developing, and the part that controls impulses isn’t fully mature. This can translate to speeding, aggressive driving, and showing off for friends.
- Gender and Aggression: Studies and anecdotal evidence often suggest that men engage in more competitive and aggressive driving behaviors than women, leading to more speeding.
- The “Enthusiast” Factor: People who buy performance-oriented cars like a Subaru WRX or a Volkswagen GTI often do so because they enjoy spirited driving. It’s no surprise that these drivers are more likely to push the speed limit and, consequently, get more tickets.
👮 Enforcement Patterns and Police Discretion: A Critical Look
This is where things get murky. The data doesn’t just reflect who is speeding; it also reflects who is being policed.
- Police Discretion: An officer has a lot of leeway in any given traffic stop. They can choose to give a warning, issue a ticket for the clocked speed, or “discount” the speed to a lower fine. The Econofact study shows this discretion is not always applied equally across racial groups.
- Geographic Deployment: Police departments often concentrate their resources in certain areas. As the Econofact article points out, “Minority drivers are more likely to encounter officers that offer no leniency to drivers of any race.” This means that simply driving in a particular neighborhood can dramatically increase your chances of receiving a harsher penalty.
- “Fishing Expeditions”: Critics of some policing strategies argue that minor traffic stops (like a broken taillight or failure to signal) are sometimes used as a pretext to investigate the driver for other, unrelated crimes. Data from Illinois suggests Black drivers are disproportionately subjected to these kinds of stops.
👁️ Visibility and Stereotypes: How Perceptions Influence Stops
Finally, we can’t ignore the role of visibility and stereotypes—both for cars and drivers.
- The “Red Car” Effect: Does a red car really get you pulled over more? The myth persists for a reason. While white cars may get more tickets overall simply because there are more of them, some studies show red cars are ticketed at a disproportionately high rate. A bright, flashy car—whether it’s red, yellow, or lime green—is simply more noticeable. It stands out from the sea of silver and black commuters, drawing the eye of law enforcement.
- Driver Stereotypes: Unconscious bias can play a role. An officer might subconsciously associate a young male in a modified Honda Civic with street racing, or a person of color in an expensive car with suspicion. The Stanford Open Policing Project found evidence of this by comparing stop rates during the day versus at night; when it’s harder to see a driver’s race, the disparity in stops between Black and white drivers decreases.
✅ How to Avoid Becoming a Statistic: Our Expert Tips for Safer Driving
Nobody likes getting a speeding ticket. It ruins your day, drains your bank account, and messes with your insurance rates. Here at Car Brands™, we’re not just about the thrill of the drive; we’re about smart, safe driving. Here are our top five expert tips to keep your record clean and your money in your pocket.
1. 🧠 Drive Defensively and Mindfully on the Road
This is the golden rule. Don’t just be a passive operator of a machine; be an active, engaged driver.
- Anticipate, Don’t React: Look far down the road. See that brake light three cars ahead? Start slowing down now. Notice traffic merging a quarter-mile away? Adjust your speed accordingly. Defensive driving is about staying ahead of the situation.
- Manage Your Time: The number one reason people speed is because they’re late. It’s that simple. Leave 10-15 minutes earlier than you think you need to. You’ll be amazed at how much more relaxed your drive is when you’re not racing the clock.
- Avoid the “Flow” Fallacy: “But I was just going with the flow of traffic!” is not a legal defense. If the “flow” is 15 mph over the limit, you’re just as likely to get ticketed as the car next to you.
2. 📚 Understand Local Traffic Laws and Speed Limits
Ignorance is not bliss when it comes to traffic law.
- Know the Unmarked Limits: Many states have default speed limits for certain types of roads (e.g., 25 mph in residential areas, 55 mph on rural highways) when no sign is posted. Do you know the rules in your state?
- Watch for Speed Traps: Be extra vigilant in areas where speed limits drop suddenly, like when a highway enters a small town. These are prime spots for enforcement.
- Construction and School Zones: Fines are often doubled in these areas. There is zero tolerance for speeding when road workers or children are present.
3. 📱 Use Technology Wisely (But Legally!) to Stay Informed
Your smartphone and in-car tech can be powerful allies.
- Navigation Apps: Apps like Waze and Google Maps provide real-time speed limit information and crowdsourced alerts for police presence ahead. They are invaluable tools for maintaining awareness.
- Cruise Control: On the highway, use it! It’s the easiest way to ensure you maintain a consistent, legal speed without having to constantly monitor your speedometer. Adaptive cruise control is even better, as it will automatically adjust your speed to the traffic ahead.
- ❌ Radar Detectors: Be careful with these. They are illegal in some states (like Virginia and Washington D.C.) and in all commercial vehicles. While they can provide a warning, relying on one can make you a lazy driver.
4. 🛠️ Maintain Your Vehicle for Optimal Performance and Safety
A well-maintained car is a safer car.
- Check Your Tires: Underinflated tires can affect your car’s handling and braking distance. Ensure they are at the manufacturer’s recommended pressure.
- Brake Check: Are your brakes responsive? If they feel spongy or make noise, get them checked immediately. Your ability to stop quickly and safely is paramount.
- No Broken Lights: A burned-out headlight or taillight is what’s known as a “pretextual stop”—it gives an officer a reason to pull you over and check you out for other things. Don’t give them an easy excuse.
5. 🗣️ Know Your Rights During a Traffic Stop: Be Prepared
Even the safest drivers can get pulled over. Knowing how to handle the situation can make a big difference.
- Be Polite and Respectful: An officer’s discretion is a powerful thing. Being argumentative or rude is a surefire way to guarantee you get a ticket.
- Keep Your Hands Visible: When the officer approaches, have your hands on the steering wheel. This is for their safety and yours.
- You Have the Right to Remain Silent: You are required to provide your license, registration, and proof of insurance. You are not required to answer questions like, “Do you know why I pulled you over?” You can politely state that you prefer not to answer any questions.
🔮 The Future of Traffic Enforcement: Tech, Data, and Fairness on Our Roads
Hold on tight, because the world of traffic enforcement is on the brink of a massive technological shift. The days of an officer hiding behind a billboard with a radar gun are numbered. The future is digital, automated, and driven by data.
- Automated Speed Cameras: These are already common in many areas and are becoming more sophisticated. New systems use AI and machine learning to more accurately identify violations and can even be deployed dynamically to high-risk areas. Proponents argue they can reduce bias in traffic stops, as the camera doesn’t know the driver’s race or gender.
- Smart Infrastructure: Imagine roads that talk to your car. Vehicle-to-Everything (V2X) communication will allow infrastructure to send real-time speed limit information directly to your dashboard. In the future, your car might automatically prevent you from speeding in a school zone.
- AI and Predictive Analytics: Police departments are beginning to use AI to analyze traffic data and predict where and when speeding is most likely to occur. This allows them to deploy resources more efficiently instead of relying on random patrols.
- Drones and Aerial Enforcement: Some jurisdictions are already experimenting with drones and aircraft to monitor traffic flow and spot speeders from the sky, especially in hard-to-reach areas.
This technological revolution promises safer roads and more efficient enforcement. However, it also raises important questions about privacy, data security, and the potential for a “surveillance state” on our highways. As we move forward, the challenge will be to harness the power of this technology to improve safety while ensuring fairness and protecting our civil liberties.
🏁 Conclusion: Navigating the Complexities of Speeding Tickets and Demographics
So, who really gets the most speeding tickets? The answer is a nuanced blend of age, gender, income, vehicle choice, and geography—wrapped in layers of human behavior and systemic factors. While young drivers and men do tend to get more tickets, the surprising truth is that middle-aged adults with higher incomes often lead the pack in sheer ticket volume. Meanwhile, racial disparities in enforcement remind us that the story isn’t just about who speeds, but also about who gets stopped and how they are treated.
We’ve unpacked myths like the red car effect, explored the impact of vehicle type, and delved into the ripple effects of a speeding ticket—from insurance hikes to legal consequences. Our expert tips aim to keep you safe, savvy, and ticket-free on the road.
As technology evolves, automated enforcement and AI promise to reshape traffic policing, hopefully making it fairer and more effective. But until then, the best defense remains smart, mindful driving and knowing your rights.
Whether you’re a young driver, a busy professional, or a car enthusiast behind the wheel of a sporty ride, understanding these dynamics can help you avoid becoming a statistic—and keep your driving record squeaky clean.
🔗 Recommended Links for Further Reading and Resources
👉 Shop frequently ticketed car brands:
- Subaru: TrueCar | Edmunds | Subaru Official Website
- Dodge: TrueCar | Edmunds | Dodge Official Website
- Volkswagen: TrueCar | Edmunds | Volkswagen Official Website
Traffic school and defensive driving courses:
Legal assistance for traffic tickets:
❓ FAQ: Your Burning Questions About Speeding Tickets Answered
Which age group is most likely to receive speeding tickets?
While young drivers (16-25) are often stereotyped as the biggest speeders due to risk-taking and inexperience, data shows that adults aged 30-49 actually receive the most speeding tickets overall. This group tends to speed more consistently in daily life, often due to busy schedules and a perception that fines are manageable.
Do men or women get more speeding tickets?
Men receive significantly more speeding tickets than women—often 50% more or higher depending on age group. This is attributed to generally more aggressive driving behaviors and higher risk tolerance among men.
How does location affect the likelihood of getting a speeding ticket?
Location is a major factor. States like Ohio, Iowa, and North Dakota have some of the highest per capita speeding ticket rates. Urban vs. rural settings also matter: urban areas have more police presence but slower traffic, while rural highways tempt drivers to speed but are patrolled strategically with speed traps.
Are younger drivers more prone to speeding violations?
Yes, younger drivers are more prone to risky behaviors, including speeding, distractions, and aggressive driving. However, their overall ticket volume is often less than that of middle-aged adults, who speed more frequently but less recklessly.
What time of day do most speeding tickets get issued?
Speeding tickets are most commonly issued during daylight hours, especially during morning and evening commutes when traffic volume is higher and enforcement is more active. Nighttime stops tend to show less racial disparity, possibly due to reduced visibility.
Do sports car owners get more speeding tickets than other drivers?
Owners of sporty or performance-oriented cars like the Subaru WRX, Volkswagen GTI, and Dodge Charger are more likely to receive speeding tickets. These vehicles attract enthusiasts who enjoy spirited driving, increasing their risk of enforcement.
How do speeding ticket rates vary by state or country?
Speeding ticket rates vary widely by state due to differences in speed limits, enforcement intensity, and local laws. For example, states with higher speed limits like Wyoming and Colorado still see high ticket rates because drivers often exceed those limits. Internationally, countries with automated enforcement and strict penalties tend to have lower speeding rates.
📚 Reference Links: Our Sources and Data
- Steve Dixon Law: Who Gets the Most Speeding Tickets?
- DriveSafe Online: Who Gets the Most Tickets?
- Econofact: What Drives Racial Differences in Speeding Tickets?
- Stanford Open Policing Project: Traffic Stops Data
- National Safety Council: Defensive Driving
- Insurify: Most Ticketed Cars
- Public Policy Institute of California: Traffic Stop Disparities
Thanks for riding along with Car Brands™! Stay safe, drive smart, and remember: the best way to avoid speeding tickets is to keep your foot off the gas and your eyes on the road. 🚗💨