Support our educational content for free when you purchase through links on our site. Learn more
Which Car Brands Speed Most? 10 Often Linked 🚗

Which car brands are most commonly associated with speeding violations? Consumer-data discussions often point to Subaru, Volkswagen, BMW, Audi, Mercedes-Benz, Dodge, Infiniti, Hyundai, Kia, and Mazda—but the order varies, and no car brand makes its drivers speed. Rankings depend on what a study measures, who it samples, and whether it adjusts for how many people drive each brand.
We’ve felt how a quiet, capable car can make highway speed seem slower than it is. That’s why a brand’s performance image can spark curiosity, but the better question is whether a statistic compares ticket rates fairly—or just counts citations for popular cars.
Key Takeaways
- There is no definitive official ranking of car brands by speeding violations; different studies use different samples and methods.
- Raw ticket totals can mislead. Rates per driver or vehicle are more informative, though mileage, location, and driver demographics still matter.
- Performance-oriented brands may feature in consumer-data analyses, but an association is not proof that a brand causes speeding.
- Model and driver matter more than the badge. A sporty trim and a family SUV from the same automaker may have very different owners and uses.
- Speeding can increase crash risk and bring legal or insurance consequences. Check local rules and drive to the conditions, not just the car’s capability.
Table of Contents
- ⚡️ Quick Tips and Facts
- 🚗 What Does It Mean to Be Commonly Associated With Speeding Violations?
- 📊 How Researchers Compare Car Brands and Speeding Tickets
- Ticket Counts vs. Rates per Driver
- Why the Data Can Be Misleading
- 🕰️ How Vehicle Design and Driving Culture Shape Speeding Trends
- 🏁 Car Brands Most Often Linked to Speeding Violations
- 1. Subaru
- 2. Volkswagen
- 3. BMW
- 4. Audi
- 5. Mercedes-Benz
- 6. Dodge
- 7. Infiniti
- 8. Hyundai
- 9. Kia
- 10. Mazda
- 🏎️ Models and Vehicle Types That Draw Speeding-Ticket Attention
- 📈 Why Some Brands Apear More Often in Speeding Statistics
- Performance, Power, and Acceleration
- Driver Demographics and Ownership Patterns
- Highway Use, Visibility, and Enforcement
- 🛡️ Speeding Risks: Crash Severity, Insurance, and Legal Consequences
- 🧭 How to Choose a Car That Encourages Safer Driving
- ✅ Practical Tips to Avoid Speeding Tickets in Any Car
- 🔎 What Speeding Data Can—and Cannot—Tell You
- Conclusion
- Recommended Links
- FAQ
- Reference Links
⚡️ Quick Tips and Facts
The car brands with the most speeding tickets are best understood as brands whose owners show elevated ticket rates in particular datasets—not proof that a manufacturer makes people speed. The driver, road, vehicle model, and study method all matter.
| Quick fact | What it means |
|---|---|
| There is no universal official brand ranking. | Police and transportation agencies generally track violations and crashes by drivers, locations, or vehicle categories, not a definitive global leaderboard of makes. |
| A ticket count is not the same as a ticket rate. | A popular brand may have many tickets simply because there are many of its cars on the road. Rates adjusted for drivers or registrations are more useful. |
| Some consumer-data analyses repeatedly flag sporty or performance-oriented brands. | These are observational findings, not proof that owning a particular badge causes speeding. |
| Model matters as much as make. | A brand’s sports coupe, family sedan, and crossover attract different buyers and driving patterns. |
| Speeding carries real safety and legal consequences. | NHTSA identifies speeding as a factor in a substantial share of traffic fatalities; the exact risk depends on speed, road conditions, and crash circumstances. See NHTSA’s speeding overview. |
| Points are tied to driver records, not vehicle badges. | For example, Maryland’s MVA points guidance describes consequences based on a driver’s convictions and point total. |
Our short answer: Subaru, Volkswagen, BMW, Audi, Mercedes-Benz, Dodge, Infiniti, Hyundai, Kia, and Mazda appear in consumer-data discussions of speeding-prone ownership—but the exact order changes by dataset and year. Treat any ranking as a signal to investigate, not a verdict on the car or its owner. 🛣️
🚗 What Does It Mean to Be Commonly Associated With Speeding Violations?
“Associated with speeding” can mean several different things, and headlines sometimes blur them together.
A brand might have:
- A high raw count of speeding tickets because it has lots of registered vehicles.
- A higher ticket rate per driver or vehicle in a particular insurer or consumer dataset.
- A high share of drivers with at least one violation over a defined period.
- More speeding-related crashes in a study that examines collision records rather than citations.
Those are not interchangeable measures. A ticket is a recorded enforcement event; a crash is a separate outcome; and neither automatically reveals how many times a driver sped without being caught.
Association is not causation
A vehicle brand does not decide how fast you drive. However, vehicle performance, owner demographics, driving exposure, and model image may correlate with driver behavior. That makes a brand-level result useful for asking better questions—but not for assuming every owner behaves alike.
The same caution applies to studies of impaired driving. NIDA’s druged-driving research summary focuses on impairment, not vehicle makes or speeding rankings. It explains that drugs can affect judgment, attention, coordination, and reaction time. It does not establish that any car brand is more likely to speed.
📊 How Researchers Compare Car Brands and Speeding Tickets
There is no single national database that gives a clean, current, apples-to-aples ranking of speeding violations by automaker. Researchers and commercial analysts may instead use insurance claims, driver records, survey responses, vehicle registrations, or crash data.
That’s why two reports can produce different lists without either one necessarily being fraudulent: they may be measuring different things.
Ticket Counts vs. Rates per Driver
| Measure | What it tells you | Main limitation |
|---|---|---|
| Total tickets | How many citations were recorded for a make or model | Favors high-volume brands and widely driven vehicles |
| Tickets per registered vehicle | How often tickets occur relative to vehicle population | Registrations do not show how much each car is driven |
| Share of drivers with a violation | How many sampled owners have at least one violation | Results depend on sample size, time window, and record access |
| Speeding-related crash rate | How often a vehicle is involved in a crash where speed is a factor | A crash record is not the same as a speeding citation |
| Insurance-risk indicator | Patterns associated with claims or violations in an insurer’s data | May reflect a company’s customers, underwriting, and coverage mix |
A per-driver rate is generally more useful than a raw count, but it still needs context. If one group drives twice as many miles, for example, it has more chances to receive a ticket. Mileage exposure, location, age, and enforcement intensity can all shift the result.
Why the Data Can Be Misleading
Before trusting a “most-ticketed brand” headline, check:
- Who collected the data? Government agencies, insurers, and commercial analytics companies may have different access and incentives.
- What counts as a violation? One report may include only speeding tickets; another may combine multiple moving violations.
- What is the denominator? Look for rates per driver, vehicle, or miles driven—not only totals.
- How old is the sample? Model lineups, driver populations, and traffic patterns change.
- Is the ranking about brands or models? An automaker’s sporty models can skew a brand-wide average.
- Are confounding factors considered? Age, state, road type, annual mileage, and enforcement practices can affect results.
For broader context on how vehicle makes and markets are discussed, browse our Car Brand Lists, Car Brand Comparisons, and Car Brand Market Shares.
🕰️ How Vehicle Design and Driving Culture Shape Speeding Trends
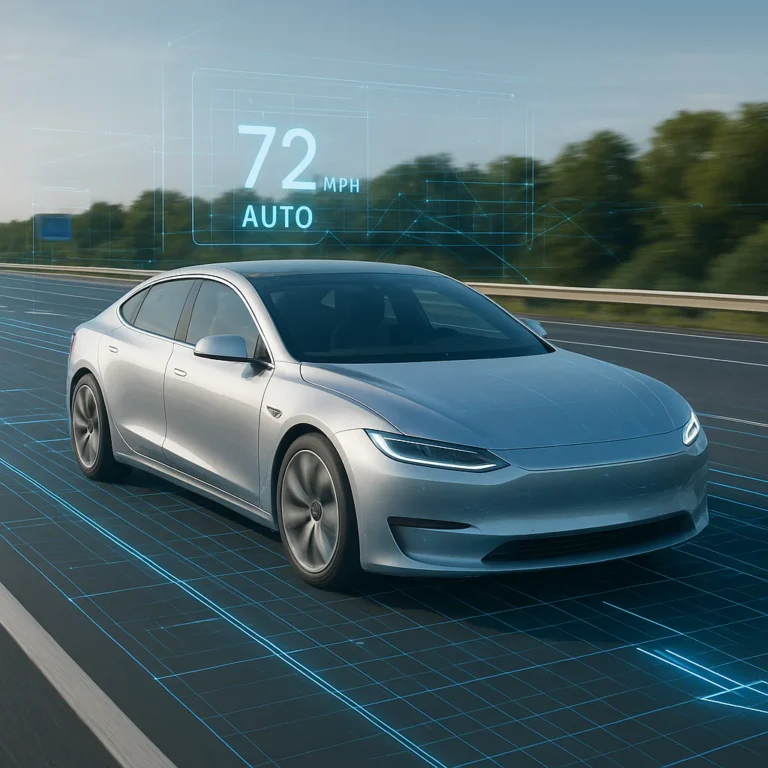
A car can make speed feel effortless. Strong acceleration, quiet cabins, stable high-speed manners, and confident handling may leave drivers less aware of how quickly they are moving. None of those traits forces speeding, but they can affect the experience behind the wheel.
We’ve had the familiar “that can’t be right” moment: the cabin is calm, the road opens up, and the speedometer says the car is moving faster than it feels. Comfort can conceal speed just as easily as performance can encourage it.
Other influences include:
- Brand image: Some makes are marketed around sportiness, performance, or driving excitement.
- Vehicle type: A sports coupe and a commuter hatchback may attract different buyers and be driven in different settings.
- Technology: Adaptive cruise control and speed-limit alerts can help drivers, but they do not replace attention or good judgment.
- Road environment: Wide, empty roads can make speeding feel normal; dense streets make the risks more immediate.
- Driver behavior: Personal choices remain the decisive factor.
For transportation-safety research and industry context, see our Auto Industry News and Car Brand Histories sections.
🏁 Car Brands Most Often Linked to Speeding Violations
The brands below are frequently discussed in consumer analyses of speeding or moving-violation patterns. This is a practical comparison list, not an official, permanent ranking. Data sources, years, and methodologies vary, and we are not claiming that every make listed has the same violation rate.
| Brand | Why it may appear in discussions | What to keep in mind |
|---|---|---|
| Subaru | Sporty models and enthusiast following | Brand-wide results mix practical models with performance trims |
| Volkswagen | Broad model range and enthusiast appeal | Ownership and driving patterns differ sharply by model |
| BMW | Performance image and powerful options | A high-performance model is not representative of every BMW |
| Audi | Strong acceleration and performance-oriented variants | Driver age, mileage, and location can influence recorded rates |
| Mercedes-Benz | Powerful engines and high-speed comfort | Luxury ownership does not itself demonstrate speeding behavior |
| Dodge | Muscle-car heritage and high-output models | A brand’s reputation can overshadow ordinary-use vehicles |
| Infiniti | Performance-oriented sedans and coupes | Smaller samples can make rates fluctuate |
| Hyundai | Large, varied lineup with sporty options | Results depend on which models and years a study includes |
| Kia | Wide range of affordable and performance-oriented models | Rapid lineup changes make old comparisons less representative |
| Mazda | Sporty handling and enthusiast appeal | Enjoyable handling is not evidence of more violations |
1. Subaru
Subaru has a strong enthusiast culture, especially around the WRX and other performance-flavored models. That makes the brand an easy candidate for speeding-related discussion, but a WRX owner and a family driving a Forester are not one uniform group.
What may contribute to the association: performance-oriented trims, enthusiastic ownership, and vehicles that feel composed on winding roads.
What the badge does not tell you: the driver’s age, driving record, mileage, or whether the vehicle is a standard model or a high-performance variant.
2. Volkswagen
Volkswagen spans practical commuter cars, family SUVs, and sporty models. A broad lineup means a single brand-level figure can blend very different driving uses.
Why it gets attention: the GTI and Golf R have long-standing performance followings, while ordinary Volkswagen models are also common daily drivers.
Our take: check the specific model and study method before treating a brand-wide statistic as meaningful.
3. BMW
BMW is closely associated with performance, rear-wheel-drive heritage, and powerful engines across much of its lineup. That can make it prominent in consumer analyses—but a brand reputation is not a conviction record.
Potential contributors: brisk acceleration, sporty marketing, and models designed to make energetic driving feel natural.
Counterpoint: a BMW also has safety systems and driver-assistance features; these can support safer driving, but they cannot override driver decisions.
4. Audi
Audi offers everything from everyday sedans and SUVs to high-performance S and RS models. Quattro all-wheel drive and confident handling can help in poor conditions, but traction is not permission to drive faster than the conditions allow.
The performance variants may influence perceptions of the brand. Still, a statistic that combines all Audi models cannot tell us which model or driver type is responsible for a pattern.
5. Mercedes-Benz
Mercedes-Benz pairs luxury comfort with a wide range of engine outputs and performance models. Quiet cabins and composed cruising can make speed less noticeable, while advanced driver aids may help with awareness.
The trade-off: technology can assist, not supervise. Drivers still need to watch posted limits and road conditions.
6. Dodge
Dodge has a powerful American performance identity, particularly through its muscle-car heritage. That makes the brand an obvious part of the conversation about speed—but brand image is not the same as measured ticket frequency.
A powerful car can accelerate quickly, so smooth throttle control matters. The fun is in having capability; the skill is knowing when not to use all of it.
7. Infiniti
Infiniti has offered performance-oriented sedans, coupes, and SUVs. In any brand comparison, smaller registration totals or survey samples can make its results more sensitive to a handful of records.
That is why we look for sample size, time period, and rate calculation before reading too much into a ranking.
8. Hyundai
Hyundai sells vehicles across a wide range of segments, including sporty N models. A broad and changing lineup complicates comparisons: a study of older vehicles may not reflect today’s models or ownership mix.
The useful question is not simply “Is Hyundai on a list?” It is which vehicles, which drivers, and what kind of violation did the list measure?
9. Kia
Kia also spans commuter cars, crossovers, and performance-oriented options. A single brand label does not capture how differently an economy-minded compact and a sport-focused model may be driven.
Look for model-level analysis where available, and treat brand-level results as a broad clue—not a verdict.
10. Mazda
Mazda often emphasizes responsive handling and an engaging driving feel. That can attract drivers who enjoy spirited motoring, but responsive steering and good handling do not automatically translate into speeding violations.
Our enthusiast verdict: a car can feel lively at legal speeds. That is one reason we like well-balanced chassis tuning; the other is that enjoyment does not have to mean driving recklessly.
🏎️ Models and Vehicle Types That Draw Speeding-Ticket Attention
Some vehicles attract more scrutiny in speeding discussions because of performance, image, or their driver population. That is not the same as a reliable, universal model ranking.
| Vehicle type or example | Why it may appear in data | What the data needs to show |
|---|---|---|
| Sports cars such as the Chevrolet Corvette or Ford Mustang | High performance and enthusiast ownership | Violation rate adjusted for exposure and owner population |
| Sport sedans such as the BMW M3 or Audi S models | Powerful engines in everyday-looking vehicles | Model-specific records and a clear comparison group |
| Hot hatchbacks such as the Volkswagen Golf GTI | Compact size with strong performance | Whether the study separates trims and model years |
| Muscle cars such as the Dodge Charger | Strong acceleration and performance identity | Ticket rates—not anecdotes or reputation alone |
| Performance SUVs such as the Porsche Macan or BMW X models | Speed and power in a practical body style | Data that accounts for mileage and vehicle use |
A quick reality check: a vehicle can be capable of high speed without being driven that way. Conversely, any car can be involved in a speeding violation. The speedometer does not know what badge is on the grille.
📈 Why Some Brands Apear More Often in Speeding Statistics
A brand can rise in a ranking for reasons that have little to do with its engineering. The most useful interpretation comes from separating the car’s characteristics from the driver, context, and data source.
Performance, Power, and Acceleration
A high-output engine can reach a target speed quickly. Drivers may also find a stable, quiet vehicle less dramatic at highway speeds than a noisy or lightly built car.
That does not mean performance features cause violations. It means drivers should be especially deliberate about:
- Checking the speedometer after accelerating.
- Avoiding sudden throttle inputs in traffic.
- Leaving extra stopping distance at higher speeds.
- Using driver aids as reminders, not as permission to disengage.
Driver Demographics and Ownership Patterns
The people who buy different vehicles may differ in age, location, driving experience, and typical mileage. Those characteristics can affect ticket exposure and risk. A brand-level result may therefore reflect who owns the cars, not only how the cars are built.
NIDA’s research shows why driver characteristics and context matter in safety analysis. Its druged-driving overview addresses impaired driving rather than brand-specific speeding, but it emphasizes that impairment can undermine safe decisions behind the wheel. It offers no evidence for assigning speeding behavior to a car make.
Highway Use, Visibility, and Enforcement
Drivers who spend more time on highways have more exposure to higher posted limits and speed enforcement. Urban drivers may face different risks, including congestion, intersections, and pedestrian activity.
The same driver can receive a different outcome depending on where and when they drive. An enforcement-heavy corridor can produce more recorded tickets than a similar road with less patrol activity, even if driver behavior is alike.
🛡️ Speeding Risks: Crash Severity, Insurance, and Legal Consequences
Speeding reduces the time available to react and increases the distance needed to stop. Higher speed also means more energy in a collision, which can make a crash more severe. NHTSA’s speeding safety guidance explains why speeding remains a serious road-safety concern.
A citation can also affect your driving record, depending on jurisdiction and the violation. In Maryland, for example, the MVA explains its driver-point system: points are tied to convictions and accumulated driving history, not to the vehicle’s brand. The agency describes escalating administrative consequences as point totals rise.
| Possible consequence | Why it matters |
|---|---|
| Fine or required court response | Rules and procedures vary by jurisdiction; read the notice and official local guidance |
| Driver-record points | Some jurisdictions assign points for certain moving violations |
| Insurance review | Insurers may consider a driver’s record when assessing risk |
| Higher crash risk | More speed can leave less time and distance to respond |
| License action | Repeated or serious violations can lead to administrative consequences |
A speeding citation is also not the same as a criminal conviction in every jurisdiction, and outcomes depend on local law and the facts of the case. Connecticut’s traffic-ticket FAQ, for instance, explains how its ticket process works but does not provide brand-based speeding data. When you receive a ticket, consult the official agency or court for your location.
🧭 How to Choose a Car That Encourages Safer Driving
A car cannot make choices for you, but certain features can support good habits. We recommend looking beyond horsepower and asking how the car behaves in everyday conditions.
Features worth considering
- Speed-limit display or recognition: Helpful as a prompt, although signs can be missed or misread.
- Intelligent speed assistance: Can warn the driver or help manage speed, depending on the system and settings.
- Adaptive cruise control: Helps maintain a following gap on some roads; it does not replace attention.
- Clear instrument display: A speedometer that is easy to read at a glance makes self-checking simpler.
- Good visibility and predictable handling: Useful for awareness and control, especially in changing conditions.
- Driver-monitoring alerts: Can remind drivers to stay attentive, but are not a substitute for rest.
A practical car-shopping checklist
- Set your priorities: daily commute, family use, weather, and typical road type.
- Test the controls: check whether you can read the speed display without taking your eyes off the road for long.
- Try the assistance features: understand what they do, where they work, and when they may disengage.
- Drive at ordinary speeds: assess comfort and visibility in the conditions you actually face.
- Compare the specific trim: engine, tires, brakes, and driver-assistance equipment may differ within one model line.
- Review safety information: check manufacturer documentation and credible safety resources before deciding.
For cross-shopping ideas, browse Car Brand Comparisons. A sporty car can still be a responsible choice; the best match is one whose performance and features fit your habits rather than tempt you into driving beyond them.
✅ Practical Tips to Avoid Speeding Tickets in Any Car
You do not need to drive a slow car to avoid speeding. You need a few repeatable habits.
- Check the posted limit whenever the road changes. Limits can shift near towns, work zones, schools, and ramps.
- Use cruise control thoughtfully. It can help maintain a steady speed on suitable roads, but avoid relying on it in poor weather or heavy traffic.
- Build in time. Rushing is one of the easiest ways to stop noticing the speedometer.
- Watch your speed after merging or passing. Acceleration can continue longer than expected in a quiet, powerful car.
- Adjust for conditions. A posted limit is not a guarantee that the speed is safe in rain, snow, traffic, or poor visibility.
- Keep your attention on driving. Avoid distractions and do not drive impaired.
- If you get a ticket, use official instructions. Response deadlines and options differ by jurisdiction; do not assume advice from another state applies.
For impaired-driving prevention, NIDA recommends planning ahead for a sober ride and arranging a designated driver when alcohol or drugs may be involved. Its guidance concerns impairment, not car brands—but the safety principle is straightforward: do not drive when your ability to do so safely is compromised.
🔎 What Speeding Data Can—and Cannot—Tell You
Brand-level data can help identify patterns worth examining, especially when a source publishes its method and adjusts for the number of drivers or vehicles. It can also help consumers think about how vehicle performance, ownership, and driving context intersect.
It cannot reliably tell you that:
- Every driver of a listed brand speeds.
- A particular automaker causes traffic violations.
- A brand with more tickets has more reckless drivers without exposure and population adjustments.
- A speeding-ticket ranking is also a crash-risk ranking.
- A result from one sample applies to every country, year, model, or driver.
When sources disagree, favor the one that explains its sample, time period, definition of “speeding,” denominator, and limitations. Give less weight to headlines that offer a definitive ranking without showing how it was calculated.
The takeaway is less dramatic than a blame-the-badge headline, but more useful: the driver’s choices matter most, while vehicle and data context help explain patterns.